SDSS Datathon 2025
TTC Subway Delay Prediction
Euichan Kim · Zhe Wang · Virat Talan · Daivi Shah
2025-03-02
My Role
● Cleaned and preprocessed over 24,000 TTC delay records using Python
● Proposed data-driven solutions to TTC delays, enhancing both operational efficiency and business applicability
● Took primary responsibility for structuring and authoring the final project report
Introduction
The TTC plays a vital role in Toronto’s urban mobility. However, its frequent delays frustrate and leave millions of passengers no other choice but to wait. Our team has analyzed the patterns from past delays and created a predictive model that forecasts the probability of future delays. We expect to provide TTC passengers a better schedule for their travel, a solution to delayed hotspots and for businesses to utilize the delays to their advantage.
EDA Findings
Our analysis of TTC subway delay data aimed to uncover key patterns influencing disruptions. The dataset includes timestamps, station locations, delay durations, and external factors contributing to delays. Key areas of exploration included identifying peak delay times and locations across different days, comparing weekday and weekend delay frequency to assess commuting trends, and analyzing external influences such as maintenance schedules that impact subway operations.
Date and time components were extracted, allowing for deeper analysis of seasonal and daily trends. The month was isolated to examine seasonal effects, while the hour and minute were derived from timestamps to analyze time-based patterns. The day of the week was also mapped numerically, with Monday as 0 and Sunday as 6, to assess fluctuations in delays throughout the week. The delay information itself was transformed into a binary classification problem, where any delay greater than zero minutes was categorized as a delayed instance.
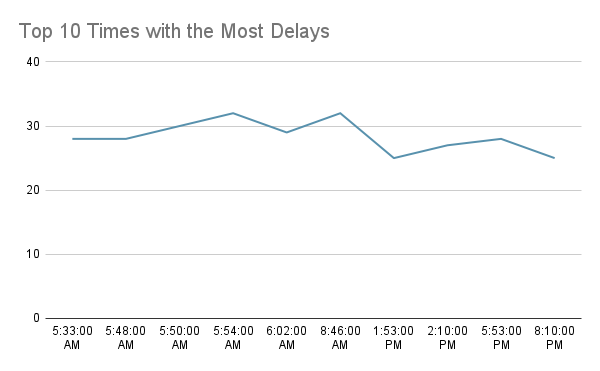
The data highlights the top 10 times with the most TTC subway delays, primarily concentrated in the early morning and afternoon hours. The highest delays occurred at 5:54 AM and 8:46 AM, both with 32 recorded delays. Notably, the early morning peak (5:33 AM - 6:02 AM) coincides with the subway system ramping up operations just before the official start at 6 AM, potentially indicating pre-service disruptions or technical issues as trains begin running.
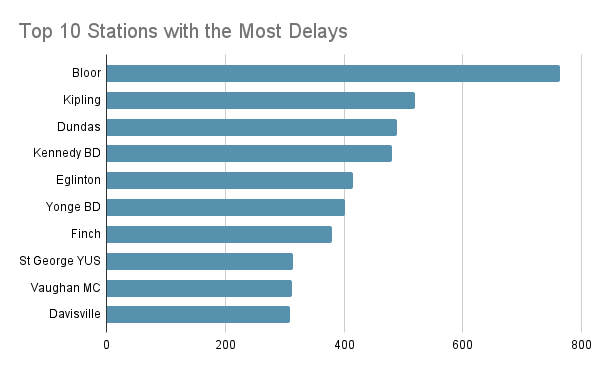
The distribution of delays aligns with peak commuting times, as many subway users rely on the system to travel to work or school. The stations experiencing the most frequent delays, such as Bloor (764 delays), Kipling (519), and Dundas (490), are critical transit hubs. Bloor-Yonge is a key interchange between Line 1 and Line 2, handling some of the system's highest passenger volumes, which could contribute to congestion-related delays. Kipling and Dundas, situated at major entry and downtown points, also experience heavy commuter traffic.
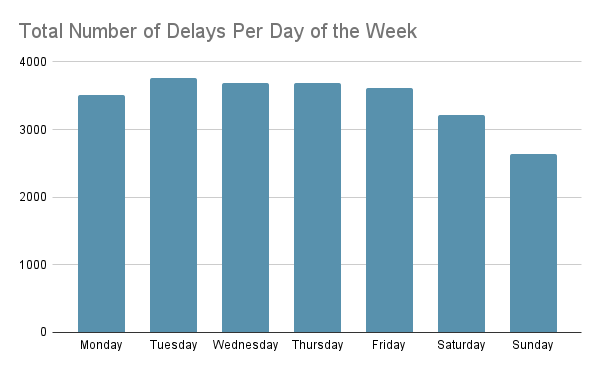
Delays are more frequent on weekdays, with Tuesday (3,768 delays) having the highest count, followed closely by Wednesday (3,693) and Thursday (3,684). This suggests that midweek experiences the greatest strain on the system, likely due to consistent work and school commuting patterns. Weekend delays, particularly on Sunday (2,635 delays), are significantly lower, possibly reflecting reduced ridership and maintenance scheduling.
Random Forest Classifier Predictive Model
To develop a robust predictive model, we trained a Random Forest Classifier to forecast the likelihood of subway delays based on historical data. The model was designed to analyze the relationship between delay occurrences and features such as month, hour, minute, day of the week, station, subway line, and train direction. These features were selected based on the insights gathered from exploratory data analysis, which identified them as key indicators of subway disruptions.
The dataset was split into 80 percent training data and 20 percent testing data to evaluate model performance. The Random Forest Classifier was chosen due to its ability to handle categorical data effectively and capture complex decision boundaries in delay patterns. Label encoding was applied to categorical variables such as station names, subway lines, and train direction to convert them into numerical representations that the model could process. The target variable, representing whether a delay occurred, was defined as a binary classification problem.
Once trained, the model achieved an accuracy of approximately 72.44 percent, indicating strong predictive capability in recognizing delay patterns. The model provides two primary outputs: a binary classification that determines whether a delay is likely to occur and a probability score that estimates the likelihood of a delay at a given time and location.
Business Insights
Enhancing TTC Service Operations
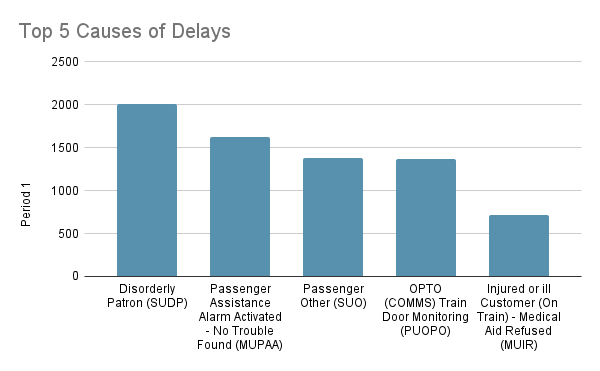
Strengthening Security and Crowd Control: Deploying additional security personnel at high-traffic stations such as Bloor-Yonge, Dundas, and Kipling will help manage disruptions. Increasing CCTV surveillance and station officer presence can deter disorderly behavior, while faster response protocols will minimize train stoppages caused by disturbances.
Passenger Assistance Alarm (PAA) Management: A significant source of delays stems from PAA activations with no issues found. Public awareness campaigns can help reduce unnecessary activations. Additionally, implementing secondary verification (e.g., conductor announcements or security camera checks) before stopping trains can reduce disruptions.

Optimizing Train Maintenance: Scheduling maintenance during low-traffic periods and prioritizing trains with frequent failures (such as vehicles 5816 and 6061, which caused 77 and 75 delays respectively) will reduce service disruptions. Predictive maintenance using real-time diagnostics can also reduce unexpected breakdowns. Major maintenance should be scheduled on Sundays or late-night hours to minimize commuter impact.
Scheduling major maintenance on lower-traffic days will reduce disruptions for commuters. Maintenance should be conducted on Sundays when ridership is lowest. Temporary bus replacement services should be used during planned service disruptions, and preventive maintenance work should be shifted to late-night hours whenever possible.
Improving Commuter Experience
Considering that most delays are caused during commuting hours, it is inevitable to reschedule the commute time for the commons. Instead, staying informed of the expected delays in real-time can help people navigate through alternative routes when necessary.
Leveraging Delay Data for Business Opportunities
TTC delays present opportunities for various businesses to optimize their strategies:
● Ride-Sharing Industry: During TTC delays, ride-sharing services like Uber and Lyft can absorb displaced passengers. By using predictive models of TTC delays, these services can adjust pricing strategies accordingly. For example, surge pricing may apply for longer trips, while discounts can be offered for less time-sensitive rides. Data from Uber Movement indicates that ride times increase by 20-40% during TTC delays, and City of Toronto data suggests that rideshare dependence rises during transit failures.
● Marketing Strategies with Digital Signage: Marketing companies can leverage real-time delay data by displaying contextual advertisements on digital signage in high-traffic stations such as Bloor-Yonge, Kipling, and Dundas. These ads can target commuters with promotions for local businesses, such as coffee shops, ride-sharing apps, or retail stores offering time-sensitive deals. This strategy not only helps increase foot traffic to local businesses but also improves brand visibility during peak delay hours.
● Business & Economic Impact of TTC Delays:
Workforce Productivity Loss: TTC delays significantly affect worker productivity. Studies show that 55% of Canadian workers are late at least once a month, and 13% of these late arrivals are caused by public transportation issues (CareerBuilder Survey, 2015). Moreover, the TTC experienced 5,903 delay minutes/month (~98 hours) in 2023, a 53% increase since 2019 (City of Toronto Open Data, 2023).
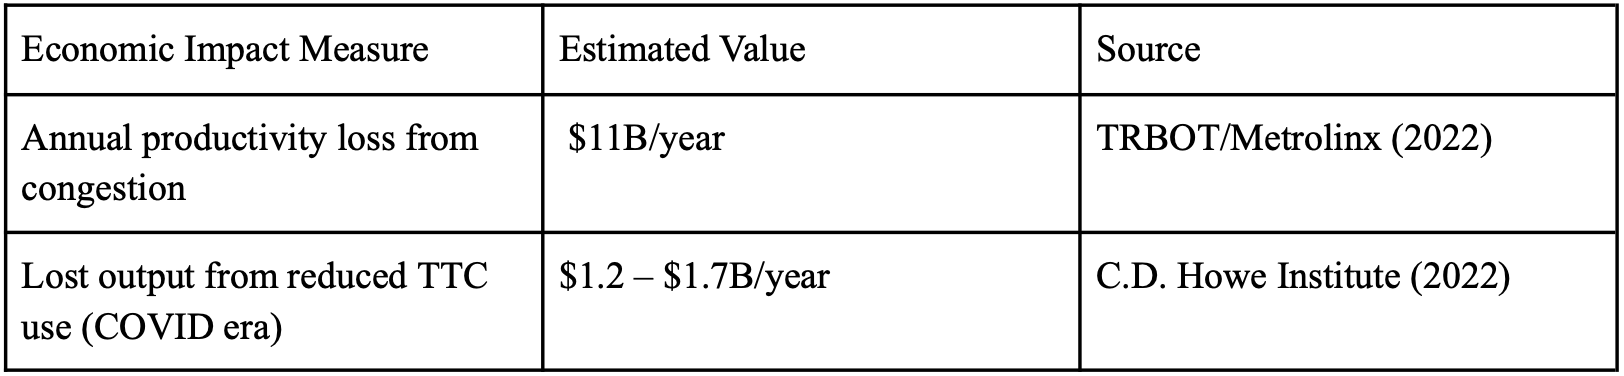
Economic Cost: TTC delays are estimated to cost $11 billion annually in lost productivity (Toronto Region Board of Trade & Metrolinx, 2022). A full TTC shutdown could result in $50 million in lost daily revenue (City of Toronto, 2024).
Impact on Key Business Sectors:
● Public Transit: In 2019, the TTC lost $74 million due to riders switching to Uber/Lyft (RideFair Coalition Report, 2021).
Food Delivery: Food delivery services like UberEats, DoorDash, and SkipTheDishes lose $30 million annually due to TTC delays (McKinsey & Co. Food Delivery Report, 2023).
Uber/Lyft Surge Pricing & Demand Spikes: Surge pricing occurs during TTC delays, leading to increased congestion and higher fares for passengers (INRIX Traffic Scorecard, 2024). City data indicates that commuters shift to ride-sharing services when TTC fails, boosting demand and costs.
Food Delivery Disruptions Due to TTC Delays: About 30% of food deliveries are delayed because of transit-related issues (McKinsey & Co. Food Delivery Report, 2023). Increased peak-hour congestion reduces customer satisfaction and leads to higher cancellations (Toronto Business Insights Report, 2023).
Why This Matters
TTC delays aren’t just an inconvenience, they hurt Toronto’s economy, reduce productivity, and cause businesses to lose revenue. A well functioning TTC benefits everyone, from commuters to corporate offices, small businesses, and ridesharing services. Addressing delays and improving reliability would lead to measurable economic gains, making Toronto a more competitive and productive city. The data proves that fixing transit inefficiencies isn't just a transportation issue, it’s an economic necessity.
Credits & Resources
Collaborators: Euichan Kim, Zhe Wang, Virat Talan, Daivi Shah
This report includes data from the TTC Subway Delay Data provided by the SDSS Datathon 2025.
Developed with ❤️ from Toronto
Copyright © 2025 Euichan Kim
Get in touch